Anomaly Detection Algorithm
Overview
Using Phase 1 analysis to detect outliers and build SPC chart, implemented algorithms by Numpy
Phase 1 analysis means the process of applying SPC chart to a training data, however data has unknown population mean and variance.
Procedure
- Applied PCA, reduce dimension of the dataset, avoid curse of dimensionality.
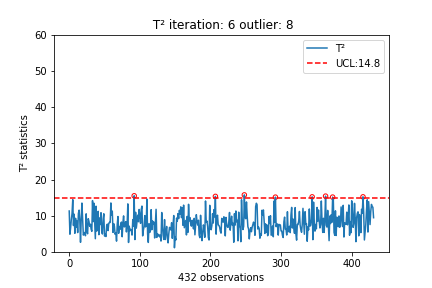
- Calculated Hotelling T2 test for phase 1 analysis, we use T2 statistics to represent how data point is located in a multivariate normal distributon (like t-statistics did).
- Plot SPC to locate outliers with alpha = 0.05, so basically upper/lower control limit can be lookup from dist table.
-
Multi-variate chart like CUSUM or EWMA are also implemented to do outlier detection in case that T2 missed some small shifts.
In a high dimension, the noise components can add up to a great magnitude, even if individual ones are relatively small. As a result, the aggregated noise effect can overwhelm the signal effects and makes it harder to reject the null hypothesis. This is known as “curse of dimensionality.”


